比利时啤酒图 - 直接从维基百科导入 GraphGist
在过去几年里,我在许多不同的地方,包括聚会、会议等等,一直在宣传 www.neo4j.com[Neo4j] 的理念。大多数情况下,我使用了一个非常受欢迎的特定演示:比利时啤酒图。它最初是我个人在 Neo4j 没有适当的数据导入功能时的一个学习经验 - 我不得不通过各种复杂的方法来加载图数据。
与此同时,情况当然发生了很大变化。现在我们有了出色的数据加载能力,在这个 GraphGist 中,我想向您展示一个基于以下内容的出色端到端数据加载示例:
听起来够简单吧?我们来探索一下。
将维基百科数据抓取到 Google 表格中
我记得“以前”我不得不手动复制/粘贴维基百科页面上的表格到电子表格中,以便将其加载到 Neo4j 中。事实证明,现在完全不再需要这样做了。在 Google 表格中,您现在有一个名为“ImportHTML”的函数,它允许您连接到 URL,选择表格,然后将该表格导入到电子表格中。在维基百科页面上有 27 个这样的表格(每个字母一个,再加上一些品牌名称不是以字母开头的啤酒),我们需要处理这些表格。使用一个公式,我们可以快速加载所有这些表格,然后使用“查询”功能删除标题行。
=query({IMPORTHTML("https://nl.wikipedia.org/wiki/Lijst_van_Belgische_bieren";"table";2);
IMPORTHTML("https://nl.wikipedia.org/wiki/Lijst_van_Belgische_bieren";"table";3);
IMPORTHTML("https://nl.wikipedia.org/wiki/Lijst_van_Belgische_bieren";"table";4);
IMPORTHTML("https://nl.wikipedia.org/wiki/Lijst_van_Belgische_bieren";"table";5);
IMPORTHTML("https://nl.wikipedia.org/wiki/Lijst_van_Belgische_bieren";"table";6);
IMPORTHTML("https://nl.wikipedia.org/wiki/Lijst_van_Belgische_bieren";"table";7);
IMPORTHTML("https://nl.wikipedia.org/wiki/Lijst_van_Belgische_bieren";"table";8);
IMPORTHTML("https://nl.wikipedia.org/wiki/Lijst_van_Belgische_bieren";"table";9);
IMPORTHTML("https://nl.wikipedia.org/wiki/Lijst_van_Belgische_bieren";"table";10);
IMPORTHTML("https://nl.wikipedia.org/wiki/Lijst_van_Belgische_bieren";"table";11);
IMPORTHTML("https://nl.wikipedia.org/wiki/Lijst_van_Belgische_bieren";"table";12);
IMPORTHTML("https://nl.wikipedia.org/wiki/Lijst_van_Belgische_bieren";"table";13);
IMPORTHTML("https://nl.wikipedia.org/wiki/Lijst_van_Belgische_bieren";"table";14);
IMPORTHTML("https://nl.wikipedia.org/wiki/Lijst_van_Belgische_bieren";"table";15);
IMPORTHTML("https://nl.wikipedia.org/wiki/Lijst_van_Belgische_bieren";"table";16);
IMPORTHTML("https://nl.wikipedia.org/wiki/Lijst_van_Belgische_bieren";"table";17);
IMPORTHTML("https://nl.wikipedia.org/wiki/Lijst_van_Belgische_bieren";"table";18);
IMPORTHTML("https://nl.wikipedia.org/wiki/Lijst_van_Belgische_bieren";"table";19);
IMPORTHTML("https://nl.wikipedia.org/wiki/Lijst_van_Belgische_bieren";"table";20);
IMPORTHTML("https://nl.wikipedia.org/wiki/Lijst_van_Belgische_bieren";"table";21);
IMPORTHTML("https://nl.wikipedia.org/wiki/Lijst_van_Belgische_bieren";"table";22);
IMPORTHTML("https://nl.wikipedia.org/wiki/Lijst_van_Belgische_bieren";"table";23);
IMPORTHTML("https://nl.wikipedia.org/wiki/Lijst_van_Belgische_bieren";"table";24);
IMPORTHTML("https://nl.wikipedia.org/wiki/Lijst_van_Belgische_bieren";"table";25);
IMPORTHTML("https://nl.wikipedia.org/wiki/Lijst_van_Belgische_bieren";"table";26);
IMPORTHTML("https://nl.wikipedia.org/wiki/Lijst_van_Belgische_bieren";"table";27);
IMPORTHTML("https://nl.wikipedia.org/wiki/Lijst_van_Belgische_bieren";"table";28)};
"select * where Col1 <> 'Merk'";0)
非常简单。它将动态更新表格中的数据 - 所以实际上我们现在可以抓取维基百科数据,并立即通过 CSV 导出使其可用于加载到 Neo4j 中。我们现在只需要将表格公开,以便 LOAD CSV 可以使用 URL 下载数据集,并确保 AlcoholPercentages 正确地作为数值加载。
使用 LOAD CSV 加载数据
由于有很多比利时啤酒(太棒了!),我们需要将一个更大的数据集加载到这个 GraphGist 中 - 所以这可能需要一些时间。我们将用来导入数据的模型非常简单
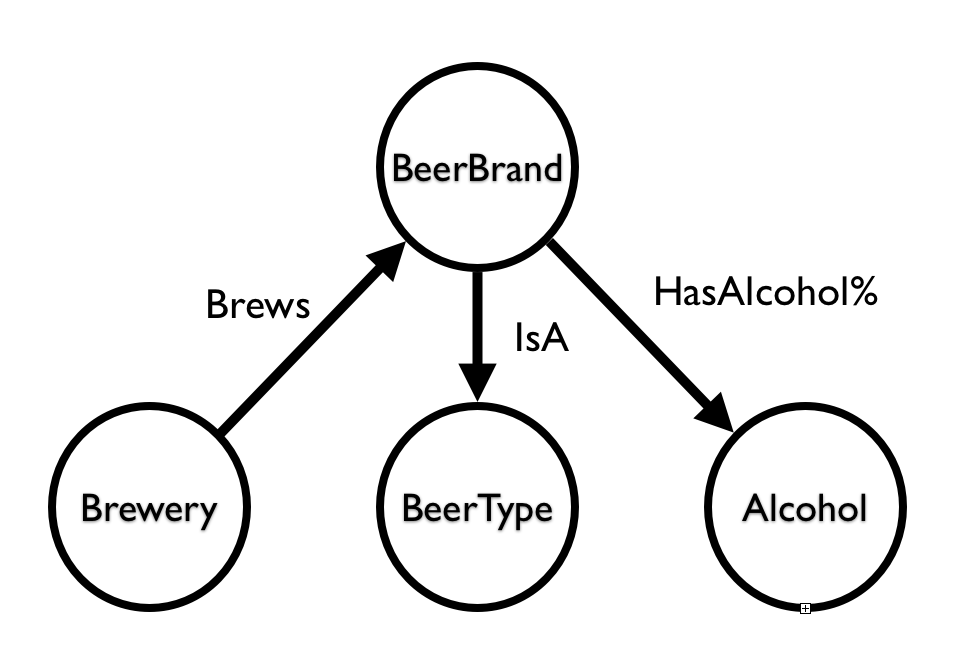
这是数据加载查询
create index on :BeerBrand(name);
create index on :Brewery(name);
create index on :BeerType(name);
create index on :AlcoholPercentage(value);

load csv with headers from
"https://docs.google.com/spreadsheets/d/1FwWxlgnOhOtrUELIzLupDFW7euqXfeh8x3BeiEY_sbI/export?format=csv&id=1FwWxlgnOhOtrUELIzLupDFW7euqXfeh8x3BeiEY_sbI&gid=0" as csv
with csv as beercsv
where beercsv.BeerType is not null
merge (b:BeerType {name: beercsv.BeerType})
with beercsv
where beercsv.BeerBrand is not null
merge (b:BeerBrand {name: beercsv.BeerBrand})
with beercsv
where beercsv.Brewery is not null
merge (b:Brewery {name: beercsv.Brewery})
with beercsv
where beercsv.AlcoholPercentage is not null
merge (b:AlcoholPercentage {value: tofloat(replace(replace(beercsv.AlcoholPercentage,'%',''),',','.'))})
with beercsv
match (ap:AlcoholPercentage {value: tofloat(replace(replace(beercsv.AlcoholPercentage,'%',''),',','.'))}),
(br:Brewery {name: beercsv.Brewery}),
(bb:BeerBrand {name: beercsv.BeerBrand}),
(bt:BeerType {name: beercsv.BeerType})
create (bb)-[:HAS_ALCOHOLPERCENTAGE]->(ap),
(bb)-[:IS_A]->(bt),
(bb)<-[:BREWS]-(br);
数据集有点太大,无法在一个图中完全可视化,但我们当然可以抽取一个包含 10 个啤酒品牌及其关系的样本
match (b:BeerBrand)
with b
limit 10
match (b)--(n)
return b,n;
我们来看一下样本
然后我们可以进行典型的啤酒查询
MATCH (orval:BeerBrand {name:"Orval"})
return orval;
然后我们再次查看结果
或者我最喜欢的查询之一:查找“Duvel”和“Orval”啤酒之间的路径
MATCH (duvel:BeerBrand {name:"Duvel"}), (orval:BeerBrand {name:"Orval"}),
p = AllshortestPaths( (duvel)-[*]-(orval) )
RETURN p;
这仍然是典型路径查找操作的一个极好示例,可以得出有趣的“啤酒推荐”——这一点我总是非常欣赏 :) …
将维基百科上的啤酒数据加载到 Neo4j 中非常简单!
这当然是我的结论。回想几年前我创建这个啤酒图所需花费的时间,以及现在变得多么容易——这简直令人惊叹。进步万岁!
希望这个 gist 对您有帮助,并期待我们很快再见。
本 gist 由 Rik Van Bruggen 创建
此页面有帮助吗?